
In order to investigate the equality of opportunity for students admitted to Emory, we must first look at the general admissions rate and compare that to admissions based on county locations.
The idea here is to find a distribution of percentile differences for a specific county to the overall admissions rate. Once that statistic is clear, we are then able to dig deeper into the socio-economic status of a particular area to determine whether the admissions process favors one group of individuals over another.

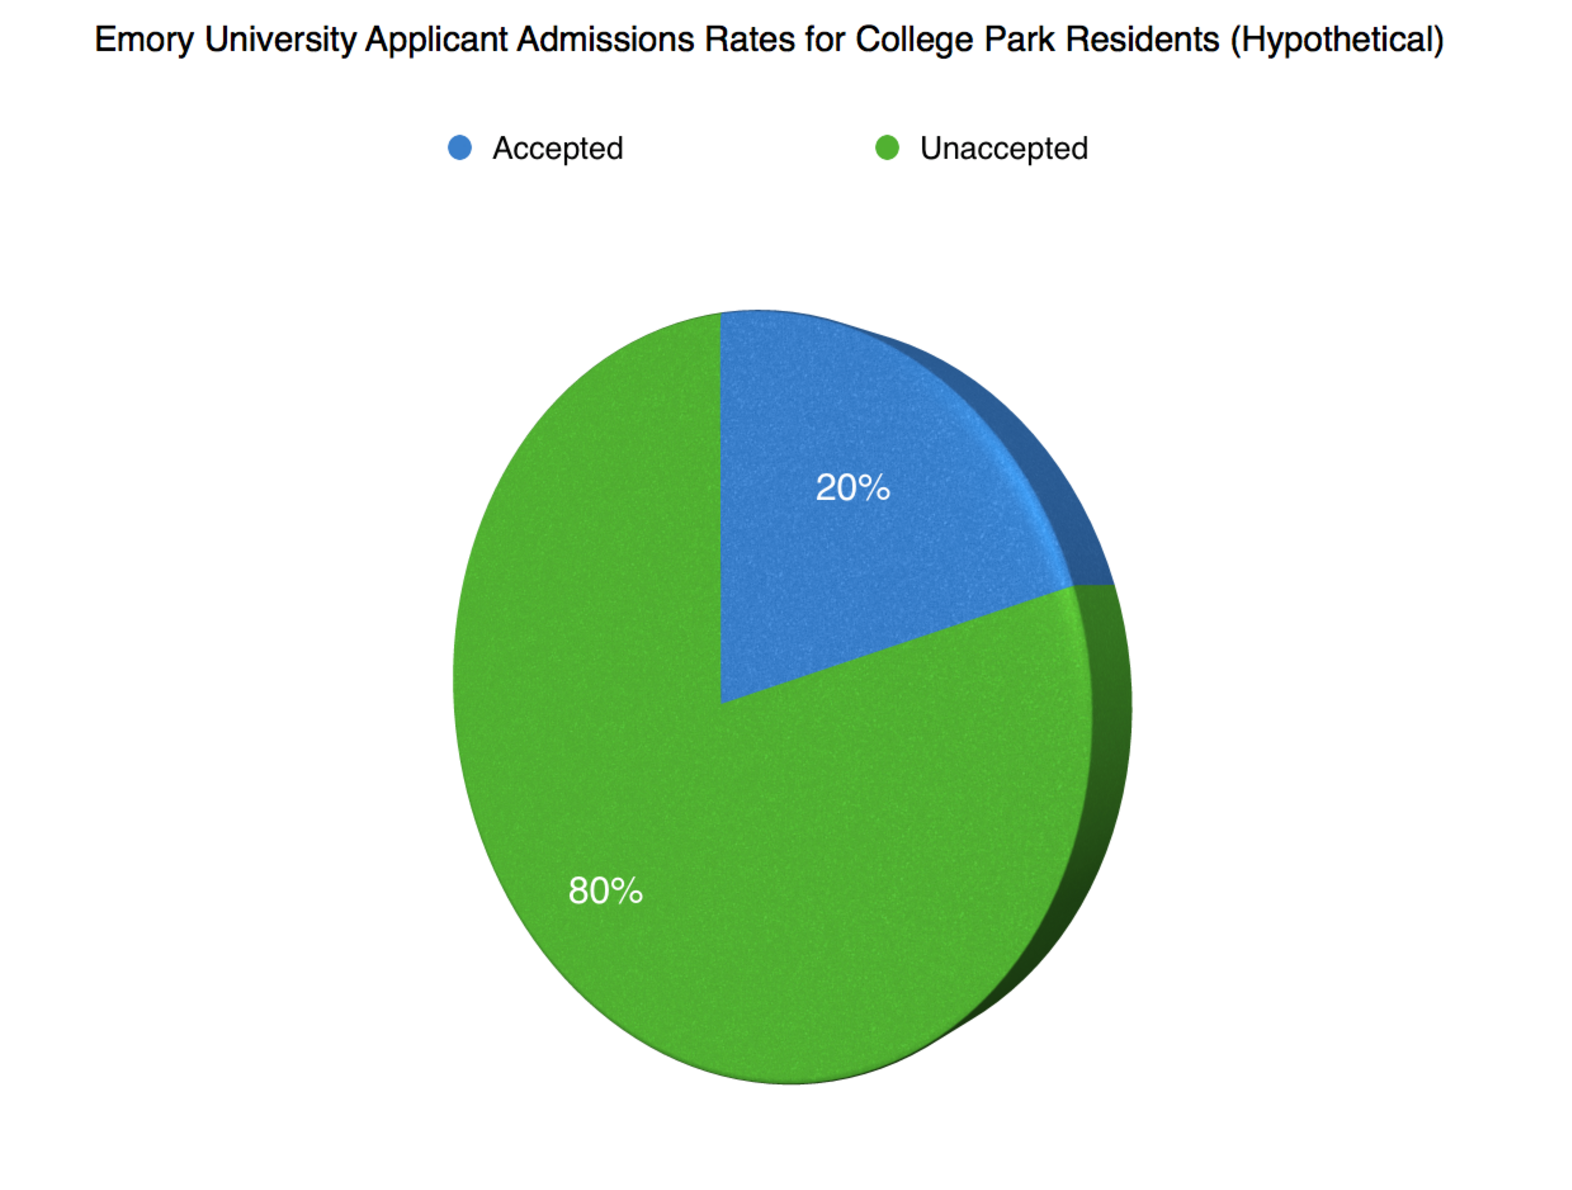
We can break this down in more detail. For example, we know already that the admissions rate for Emory undergraduate is 25.2% in 2016 (gotten through a simple google search). This number by itself is quite meaningless to us because it encompasses an application pool with applicants from all over the world. It would be too difficult to break up the applicant pool from every part of the world: without a consistent scale on which to compare the socioeconomic status of one region with another, the resulting data would be vastly skewed. Instead, the project would be much more manageable if concentrated our focus to a specific area. We chose to look at several counties that are within the greater Atlanta area that are known to have differences in economic status. For example, Buckhead has a noticeably higher wealth than College Park, one of the poorest areas around Atlanta. For these two areas, we would find the acceptance rate into Emory from the number of people who applied from a permanent address in these two areas.
The final part would be to compile the acceptance rates from all of the areas that we chose to look at. Separately, the average general acceptance rate for Emory and the acceptance rate for a specific area may not reveal much. But when we look closely at the difference in percentages, the statistics become meaningful. If, let’s say, the acceptance rate from the Buckhead area is much higher than 25.2%, then there might be an association between being wealthy and having a greater chance of acceptance into Emory. This would show that Emory favors this particular wealthy area for potential students. However, if the reverse was true, and Emory had a much higher acceptance rate in College Park, then it may suggest that Emory is trying to pull in students from lower economic classes.
Conclusions from this form of data analysis are not easy to form. There are potentially thousands of variables that could shape the admission’s decision of one individual. The dangers of making broad, sweeping conclusions include not giving enough credit to the consistency and sanctity of the admissions process, which takes into account student attributes that may not be easily translated into pure numbers. The benefit of this kind of analysis is that it gives us a general trend to work with. Unequal opportunities in education is a long term issue that requires long term, fundamental solutions. Understanding the admissions process can be imperative to creating such a solution.