

Equality of Opportunity Project
New Media Writing. ENG221s17

When thinking about endowments, it is simple to say that colleges with the largest endowments can allocate the most money to its students. These vast resources should allow students to excel and be better off than students from other schools with less money. However, this isn’t always the case as mentioned in Rhea’s post. Endowments aren’t just a bank account that universities can take money from as they please. The way they work is fairly complicated and most schools don’t give a specific layout of how they are allocating resources. With that being said, there are many factors that could play a role in why the schools with the largest endowments, don’t necessarily have greater social mobility.
The data shows that while UCLA has the highest social mobility, Harvard has the highest endowment by far. Looking into their endowments may provide reasons why this is the case. From the data released from each college, two statistics stand out: amount of private donations and operating expenses. According to the Crimson, Harvard raised $1.19 billion in private donations in 2016, whereas, UCLA raised $314 million. The issue with private donations is that most of them come with stipulations on how the funds are used. For example, the money may only be allowed to go towards a scholarship or a specific course of study. While private donations definitely help the university in terms of resources, they usually can’t spend them how they want to. The operating expenses for each school are also interesting. Harvard reported they had an operating cost of $4.7 billion in 2016 and UCLA reported $6.7 billion. It makes sense that UCLA has greater expenses because their total enrollment (undergraduate and graduate) is over 43,000 students, whereas, Harvard’s total enrollment is around 22,000. UCLA has nearly double the amount of students, yet, Harvard spends close to what UCLA spends so the question is what exactly are the schools spending their money. As mentioned before, it’s difficult to find exactly where schools spend their money so the best we can do is superficially look at the data until schools start providing a more clear picture of their expenditure.
Another thing you have to consider is how you define social mobility. The data from the Equality of Opportunity Project defines social mobility as, “Percent of Children who Come From Bottom Quintile and Reach Top Quintile.” This means in order for a student to achieve social mobility, their parents must have an income that falls in the bottom 20% and the student’s income falls in the top 20%. The Equality of Opportunity project uses a fairly specific definition for social mobility which could make the percentages lower. Additionally, marriage complicates statistics. If someone from the bottom quintile were to marry a person from the top quintile, on paper it would show as social mobility. Depending on who you ask, this is social mobility or it isn’t.
Lastly, when looking into social mobility, it’s important to look at low income access as well. The Equality of Opportunity Project defines low income access as the percent of parents from the bottom quintile so essentially, how many of the students attending a university have parents coming from the bottom 20%. Plotting the data, shows there is a correlation between low income access and social mobility. Statistically, this could just mean that because there are more students from the bottom 20% at a particular school, there are more students that move to the top 20%. However, with all statistics, there underlying variables that can’t be shown in the data.
In our previous post discussing a graph we constructed that compared mobility rate, endowments and top-tier public and private schools, there were two points that immediately took our interest. UCLA and UC Berkeley has a much higher mobility rate than any other school listed yet they are towards to lower end of the endowments.
The question we want to ask is: WHY?
We decided to look into the allocation of UC Berkeley’s endowments to see if they were spending their money on certain areas that could attribute to their students’ success.

This was tough. The information I could find online required some sort of financial or banking knowledge, neither of which I have. Apparently, they do not readily hand out information on the specific allocation of endowments online, so it is definitely something we want the Equality of Opportunity Project to get data on.
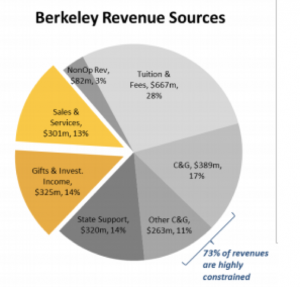
From what we gathered from the Office of the Chief Financial Officer on UC Berkeley Budget Plant, about $325 million comes from endowments. UC Berkeley receives an endowment of about $1.58 billion. State support nearly matches that amount in revenue sources. Looking at Trish’s post before this, Emory University has a $6.7 billion endowment: over 4X the amount of Berkeley’s. Yet, their spendable portion ($318.2 million) is less than Berkeley’s ($325 million). Interestingly enough, Emory’s mobility rate is 3.6% while UC Berkeley’s rate is 8.8% and UCLA’s is 10.2%. Maybe it is not the endowment itself, but the spending portion of the endowments that go into the schools.
Do endowments really play a factor into success of the students? Keep in mind, the lower end of endowments of the top tier schools are still from $1-3 billion. Obviously, all schools need a certain amount of money to provide students with professors, equipment and resources to guarantee a higher education. However, there might be a threshold to which success can be attributed to endowments. Nevertheless, we can only attempt to point out the patterns we see. To truly study this aspect of colleges, there needs to be access to the information regarding the allocation of these funds.