
Warning: Attempt to read property "ID" on null in /home/davidmor/eoop.davidmorgen.org/wp-content/plugins/subscribe-to-comments/subscribe-to-comments.php on line 212
Problematic Statistics: Why Gathering Data Remains a Barrier

Other than the pure applicant data that Emory would, reasonably, be unable to provide, there are many other pure data problems that present themselves in this project. Here are just some of the few.
1. We could not reasonably expect Emory to release (at least recent) applicant information, even anonymously. Released data on accepted students could reveal information on the selective process which can very easily be called into question. This lack of information prevents any project such as this to be grounded with extreme statistical significance.
Additionally, because the college admissions process is so heavily guarded, it would create a major headache if data on admitted vs rejected students was ever leaked to the public. Especially in the current social environment around college acceptances, such information could create basis for lawsuits.
2. In order to account for all the variables within this project, we need to take a look at the data for socioeconomic status in our focus areas (Buckhead, College Park, etc). However, even after narrowing our locations to these small counties, there are still massive variation. Let us, for a moment, consider that it is possible to gather the necessary data, that all of it is truthful, and that there is sufficient data to account for statistical variance. Even with these three factors guaranteed, it would still be difficult to decide on the number that uniformly and fairly represents the entire county. If we decide on the mean, ultra high income families or those with special circumstances would skew the entirety of the data to the right. If we decide on the median, we are effectively ignoring the upper and lower echelons of data, meaning that our final conclusion would be less accurate the farther we moved away from the central data point.
3. Within this project, we also require government data that deals with spending per student in a certain areas. This, of course, brings in another complication as we decide how to deal with school districts within a county. Like the household income, difference districts receive different amounts of funding. How the individual schools actually use and report this information has shaky credibility at most. And if we could even bring all this data together, we would still need to differentiate between the source of funding – private and public money sources are important to distinguish.
All of these challenges point towards a need to avoid empirical, sweeping conclusions. In our investigation to find trends in admissions, we must take care to justify how a certain set of data applies to a certain conclusion. It may be more productive to actually to form separate admissions conclusions based on very specific sets of requirements. The decisions made with regards to how data will be interpreted should be an ongoing, evolving process.
The Difficulty of Understanding Admissions
The admission’s process is complicated.
Even with the hundreds of college support organizations and companies advertising their guarantee to get you into the best colleges by hiring ex-admissions officials, alumni, and test-taking experts, it is still one of the most difficult endeavors to pin down exactly what colleges are looking for.
The “holistic” approach to college admission has in equal parts brought joy and confusion to applicants. Applicants are more hopeful now that college admissions does not rely on just empirical data such as gpa or standardized test scores. And for good reason too: a purely mathematical approach to admissions could neither possibly account for the value that a student could bring to a college nor the quality and difficulty of pre-college education. Alternatively, sometimes, it can feel like there is no clear-cut path to studying at the best colleges: it is difficult to tell how much a certain part will affect the application as a whole.
Usually, all we get from the college as applicants is the admissions rate and an questionable college ranking done by third party (or are they?) organizations. And we hold these pieces of information more closely than we might imagine. We take these numbers at face value, and plan our applications around them.
What else can we understand about the university admissions process through statistics? In this particular case, we are focusing on what has generally been considered to be one number: the admissions rate. But what if we decided that there are multiple admissions rate. Surely, the admissions rate of one area can be vastly difference from that of another. If we can find more information through the number that influences students so much in their college decisions, perhaps we can begin to understand more deeply, the nature of how the college education system functions.
Study of Admissions By County
In order to investigate the equality of opportunity for students admitted to Emory, we must first look at the general admissions rate and compare that to admissions based on county locations.
The idea here is to find a distribution of percentile differences for a specific county to the overall admissions rate. Once that statistic is clear, we are then able to dig deeper into the socio-economic status of a particular area to determine whether the admissions process favors one group of individuals over another.

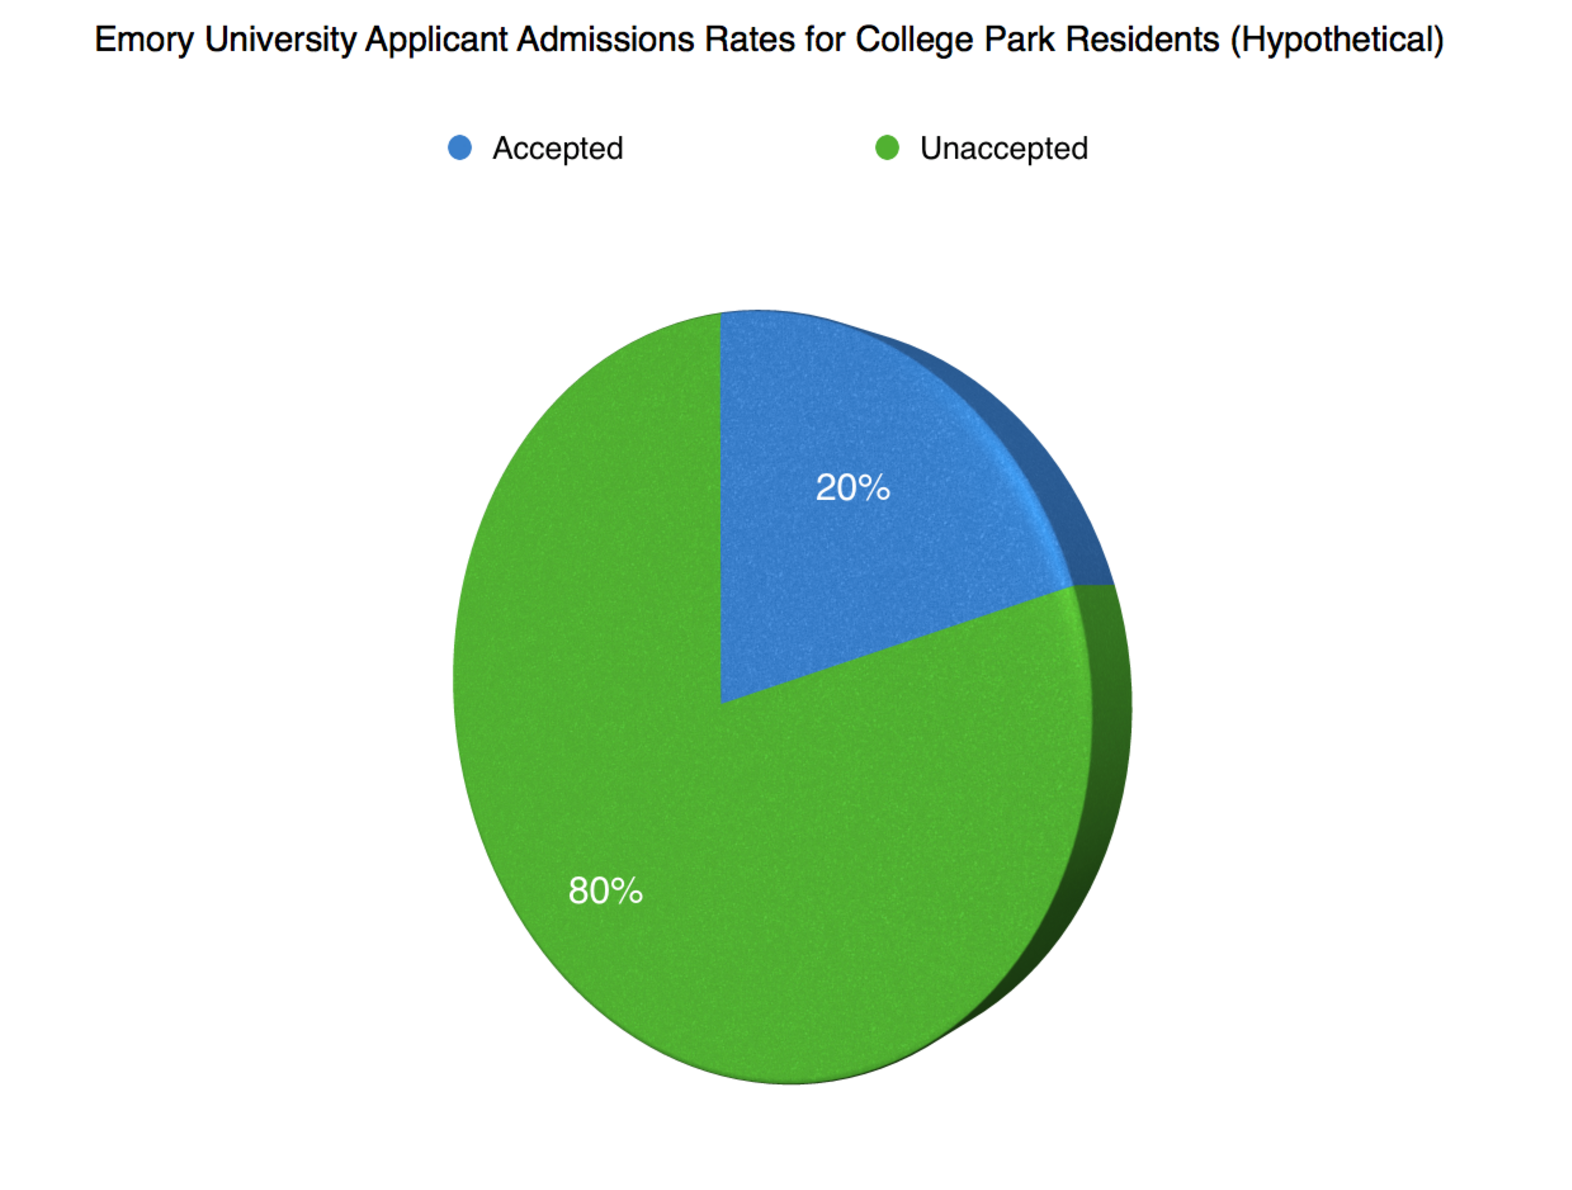
We can break this down in more detail. For example, we know already that the admissions rate for Emory undergraduate is 25.2% in 2016 (gotten through a simple google search). This number by itself is quite meaningless to us because it encompasses an application pool with applicants from all over the world. It would be too difficult to break up the applicant pool from every part of the world: without a consistent scale on which to compare the socioeconomic status of one region with another, the resulting data would be vastly skewed. Instead, the project would be much more manageable if concentrated our focus to a specific area. We chose to look at several counties that are within the greater Atlanta area that are known to have differences in economic status. For example, Buckhead has a noticeably higher wealth than College Park, one of the poorest areas around Atlanta. For these two areas, we would find the acceptance rate into Emory from the number of people who applied from a permanent address in these two areas.
The final part would be to compile the acceptance rates from all of the areas that we chose to look at. Separately, the average general acceptance rate for Emory and the acceptance rate for a specific area may not reveal much. But when we look closely at the difference in percentages, the statistics become meaningful. If, let’s say, the acceptance rate from the Buckhead area is much higher than 25.2%, then there might be an association between being wealthy and having a greater chance of acceptance into Emory. This would show that Emory favors this particular wealthy area for potential students. However, if the reverse was true, and Emory had a much higher acceptance rate in College Park, then it may suggest that Emory is trying to pull in students from lower economic classes.
Conclusions from this form of data analysis are not easy to form. There are potentially thousands of variables that could shape the admission’s decision of one individual. The dangers of making broad, sweeping conclusions include not giving enough credit to the consistency and sanctity of the admissions process, which takes into account student attributes that may not be easily translated into pure numbers. The benefit of this kind of analysis is that it gives us a general trend to work with. Unequal opportunities in education is a long term issue that requires long term, fundamental solutions. Understanding the admissions process can be imperative to creating such a solution.
