
College Location and Mobility


The data presented in these graphs were obtained from Equality of Opportunity College Level Characteristics. Graph 1 compares the location of the top 20 colleges and graph 2 compares the locations of all 190 colleges from the data. The top 20 colleges are highlighted in a separate graph for they had the highest mobility rates out of 190 colleges in the data. Looking at graph 1, 75% ofthe top 20 colleges are in the northeast, 15% are in the south and 10% are in the West. These top 20 ranking colleges in the data set provide the highest upward mobility of students enrolled. These colleges are less selective than Emory for instance but their mobility rate exceeds Emory along with other top ranking colleges like Harvard, Stanford, Duke, etc. Here, we’ll be taking a look to see if there is some correlation between location of these colleges, accesses, financial availability and fund provisions for these top 20 colleges. We’ll be considering these factors to find similarities or dissimilarities between the opportunities provided regionally and how that contributes to where the top mobility colleges are located where they are and why they are so successful.
May Wong wrote an article for Stanford News titled Stanford research analyzes colleges as engines of upward mobility. The article mentions that public colleges and universities “dominate… highest mobility rates, and all are located within California, New York and Texas”. Data collection for that research study, was gained from studying the “anonymized tax records” of 2187 American colleges from years 1999 – 2013. The data used to generate graph 1 was obtained from Equality of Opportunity Project. It’s not surprising to see the top states having the highest mobility (out of the top 20) being the exact same states mentioned in this article. The article then goes on to describe how these colleges admitted have large numbers of students who are low -income but they’ve yet to see how well and what is the correlation between mid tier public schools and high mobility rates. The article also mentioned a paper from Equality of Opportunity Project which talks about how kids from richest/top 1% class are close to 80% likely to attend Ivy League colleges compared to the nations bottom 5th percent.
But back to the topic of college location effect on mobility, this article does not articulate well that connection. It’s difficult to find the connection because a multitude of external factors are at play. The community, surroundings, funding, and public school education of states are not entirely equal so it’s difficult to control for that and pinpoint exactly why there could be an association or trend.
Major Distribution
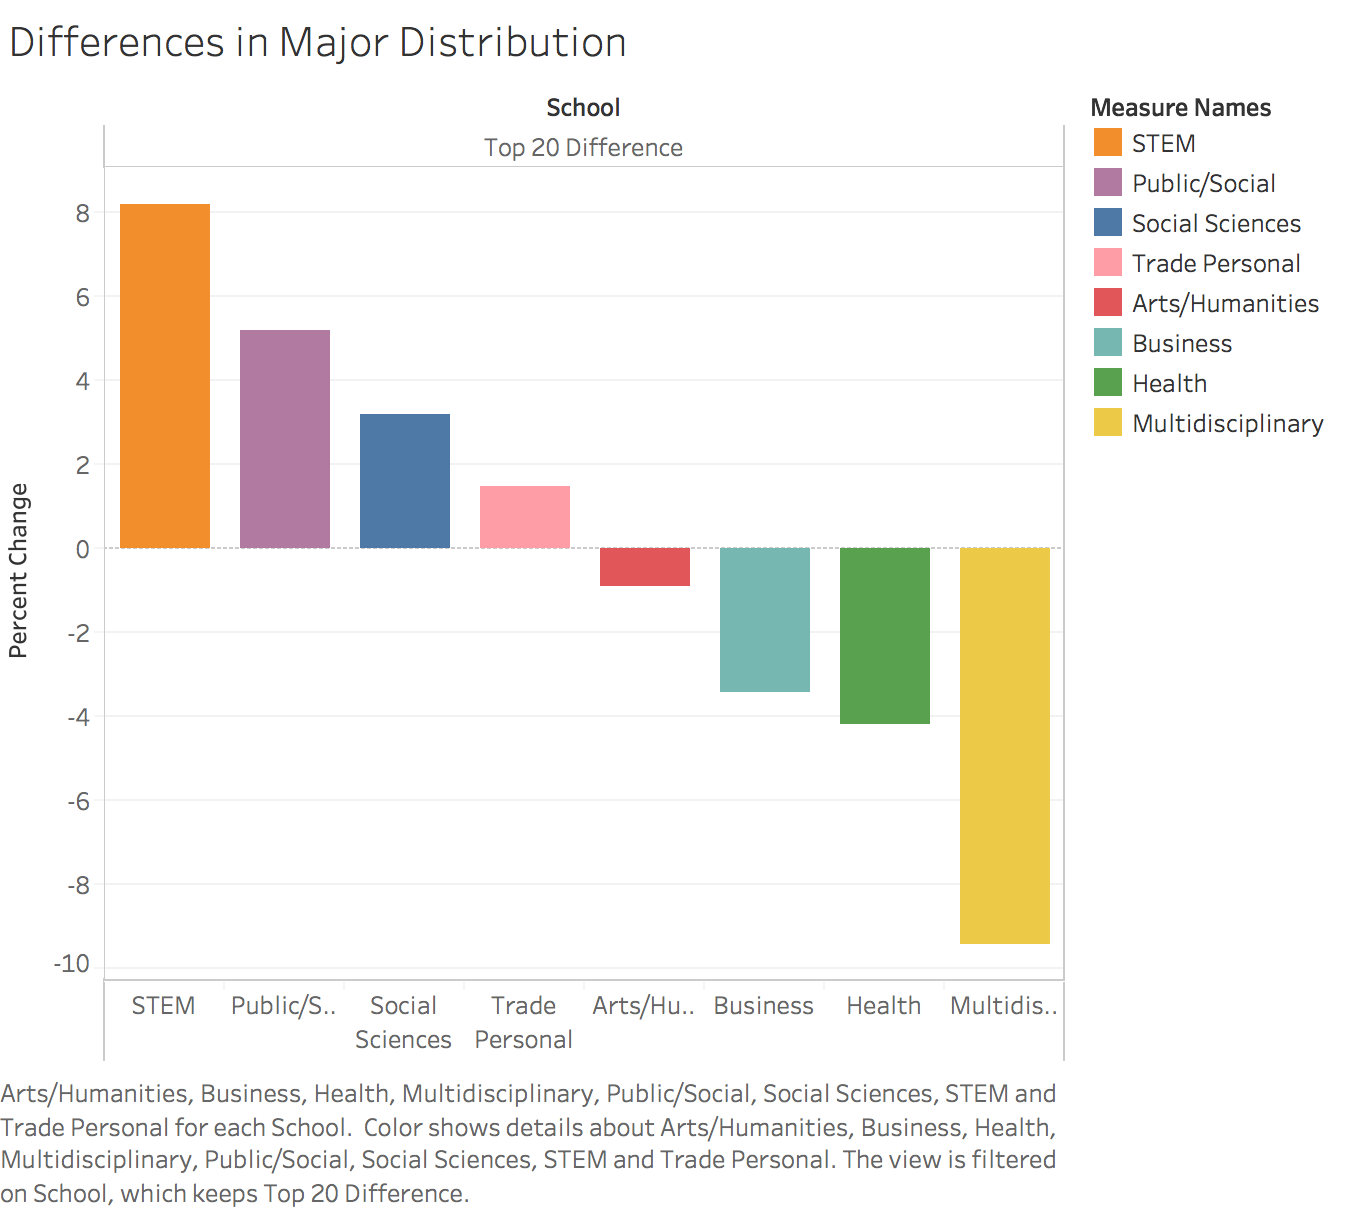
We wanted to study the discrepancies in major distribution between the top 20 schools and those outside the top 20 because some majors are statistically proven to lead to more financially rewarding career paths. We looked to see if it was just a simple case of certain schools devoting more of its resources on academic fields with the highest financial potential.
As you can see in the bar graph, compared to all other schools outside of the top 20 in terms of mobility rate, the top 20 schools’ aggregate major distribution is dominated by STEM subjects as well as majors related to public/social work. There is a +8% percent change in the number of STEM students compared to the average major distribution of the schools outside of the top 20, as well as a +5% change in public/social work majors. Moreover, social sciences and trade and personal services are also attractive options for students who attend the top 20 schools. Perhaps not too surprisingly, there are fewer students in these schools who pursue the arts or humanities subjects, but in the same vein, I would not have expected the social sciences to be such a popular field. Also, there are fewer Business majors in these schools, which was also a bit of a surprise to me. Overall, I think the overall conclusion that can be drawn from this data is that students in the top 20 are more drawn to hard skills and the technical fields. Whether it is because these schools offer attractive programs in these departments and do a better job recruiting students who are interested in these subjects cannot be determined in this dataset.
Equality of Opportunity Project Intro Draft
The equality of opportunity project include data on economic and social mobility of students from hundreds of schools across the nation. My group thus far has gathered data on the top 20 schools based in mobility rate. Our idea is to compare these top 20 schools and see what characteristics they have in common. Perhaps if we study them closely we can figure out what it is that makes these schools so successful at moving students who come from the bottom 20% of the nation up to a higher earning potential.
The next logical step in our process should probably be to visualize the data we have for the top 20 schools now and find trends among these institutions. After, we have these trends, figuring why these attributes allow for a higher mobility rate might be one of our priorities. We may also want to compare these common traits to schools with a lower mobility rate in order to see what those schools can change to increase their respective rates.
Ideally by the end of the project we will be able to add on to the conversation about which elements in the school system offer students the chance to succeed in their undergraduate education. We may be able to combine our new found data with other groups and ultimately come to a different interpretation than what we originally thought as well.