
Equality of Opportunity
At the beginning of the project, our group was struggling to come up with a question that could be answered with the data we had. We were thinking of very broad questions that had many variables within it that made it difficult to answer. After tossing around ideas, we eventually agreed that we were interested in whether there was a gender difference in college tiers within each income level.
Before making the graphs, we went on the site and looked at the data. There were two tables that contained data on gender, and one of them contained the information we needed. The hard part came next. I am not a data driven person and it was challenging to see which variables went where in making the graphs. After playing around with the variables and the different graphs, I eventually made 3 graphs. All three measured male vs. female, mean parental income, and college tier. The first was a double bar graph that contained both male and female on the same graph next to each other. The other two were the same; however, one was for females and one was for males. For the purpose of our question, I think that the first one that had measured male and female students side by side is more appropriate to the question that we are asking.
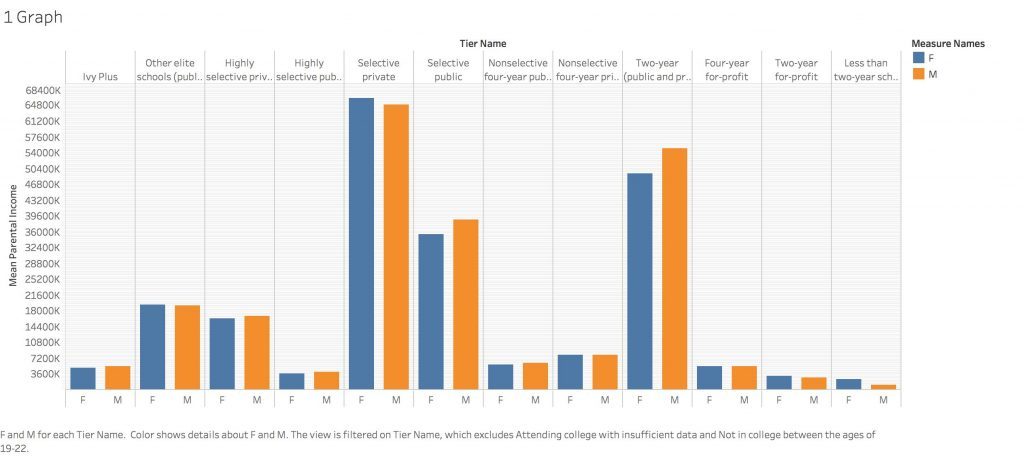 From looking at the data, I had expected that there would be more females attending college overall as you went down the income brackets; however, this was not the case. In most instances, both genders were about equally present at the colleges. In the highest income bracket, there were more females attending selectively private colleges than males, which differed from a NY Times article I had read that stated that at the highest income level, there were more males attending colleges than females. After looking at the data and seeing the trends, I think that in the future it would be interesting to look at other factors, such as race, and see how this affects the data.
 From looking at the data, I had expected that there would be more females attending college overall as you went down the income brackets; however, this was not the case. In most instances, both genders were about equally present at the colleges. In the highest income bracket, there were more females attending selectively private colleges than males, which differed from a NY Times article I had read that stated that at the highest income level, there were more males attending colleges than females. After looking at the data and seeing the trends, I think that in the future it would be interesting to look at other factors, such as race, and see how this affects the data.